
Introduction to VigorACS Dashboard
ACS provides a management system with web interfaces. You can monitor the network and configure it from a different platform. The first page you will be heading into is the Dashboard, where you can find summary information for both Network Groups and CPE.
Group Network
The first part would be the Network group dashboard which integrates details for devices in the network or groups in the network: At the right top of the page, you can customize which panel should appear on the dashboard.
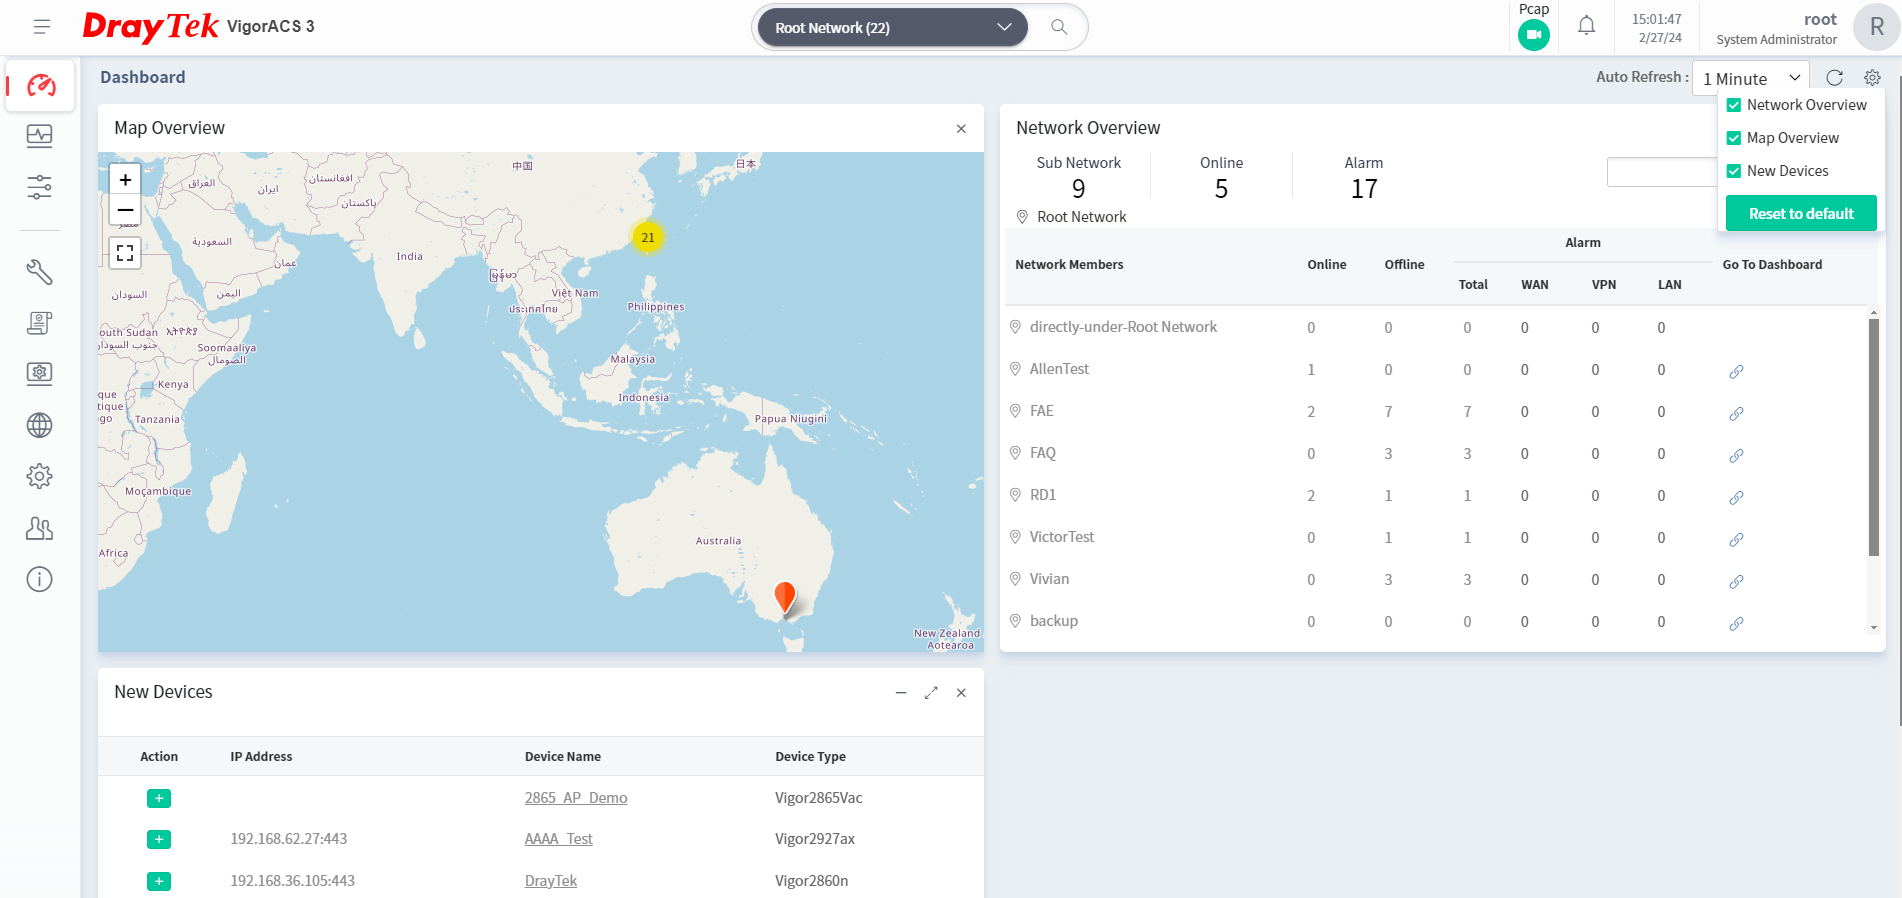
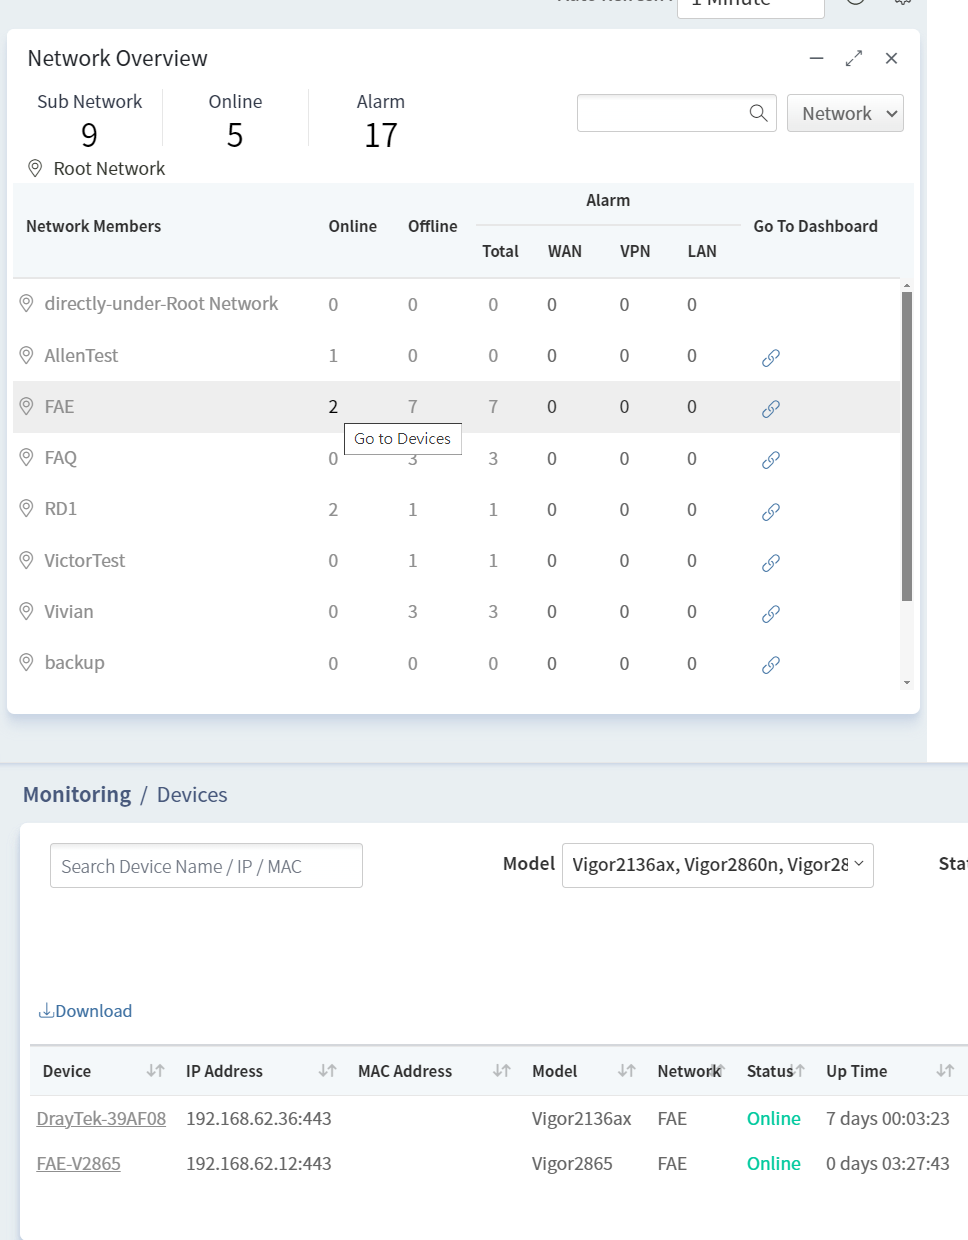
Network Overview
An overview of each Network, showing the numbers of CPEs that are Online or Offline. You can check the device information by clicking the number on the overview.
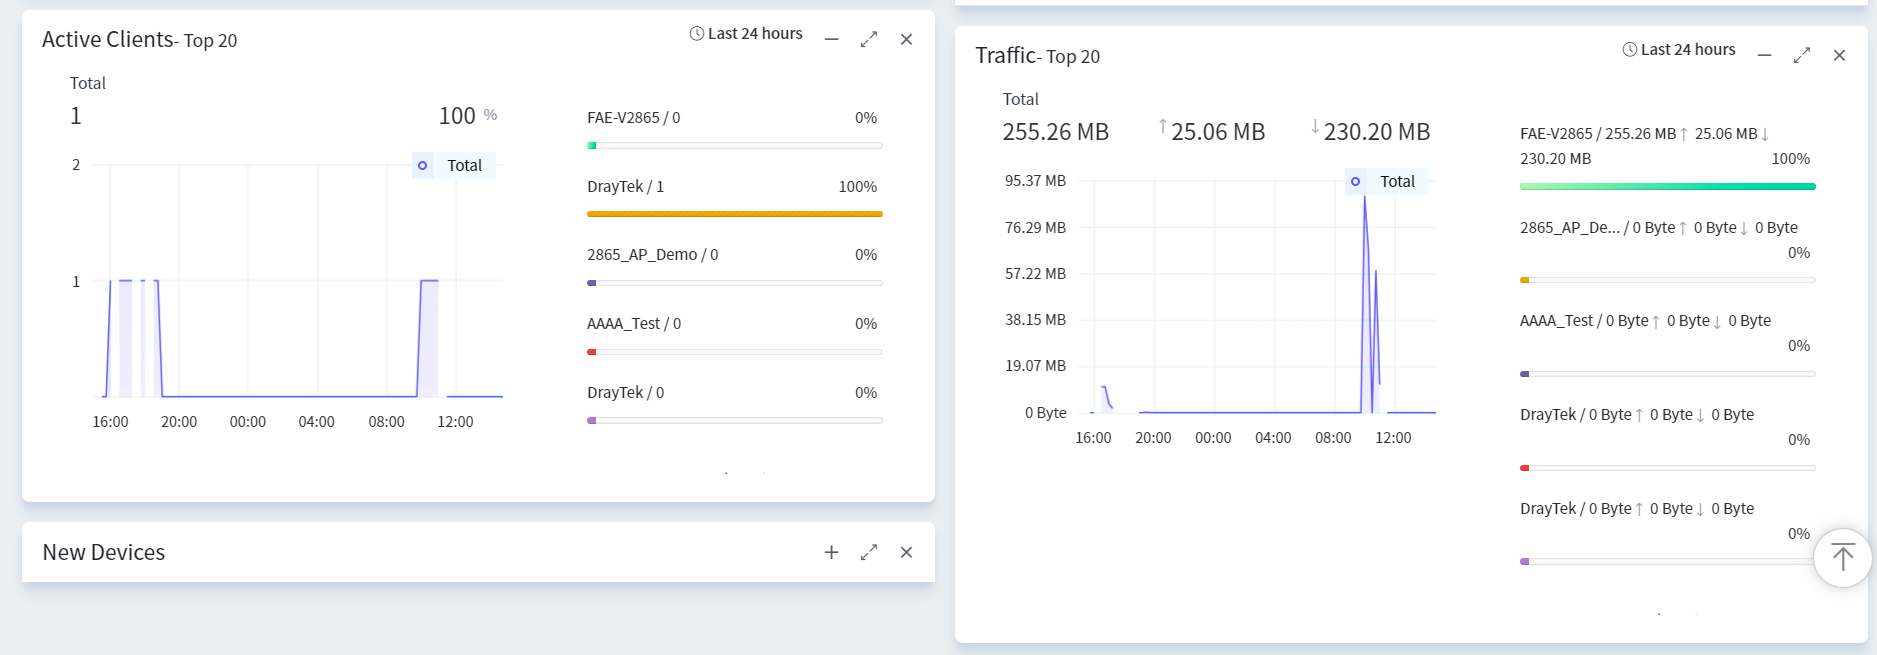
Network ranking by Client Number & Traffic amount
Active clients and Traffic panel show the holistic information of subset groups or devices. For example, if you are checking the Root network dashboard, all network groups will be included on the panel. The panel takes a reference to the ranking of the traffic or active clients to display its sequence. You can also click on the group name to compare the statistics between the specific group and the total number. Also, the panel is flexible that you can change the period, Last 24 hours /7 days/30 days.
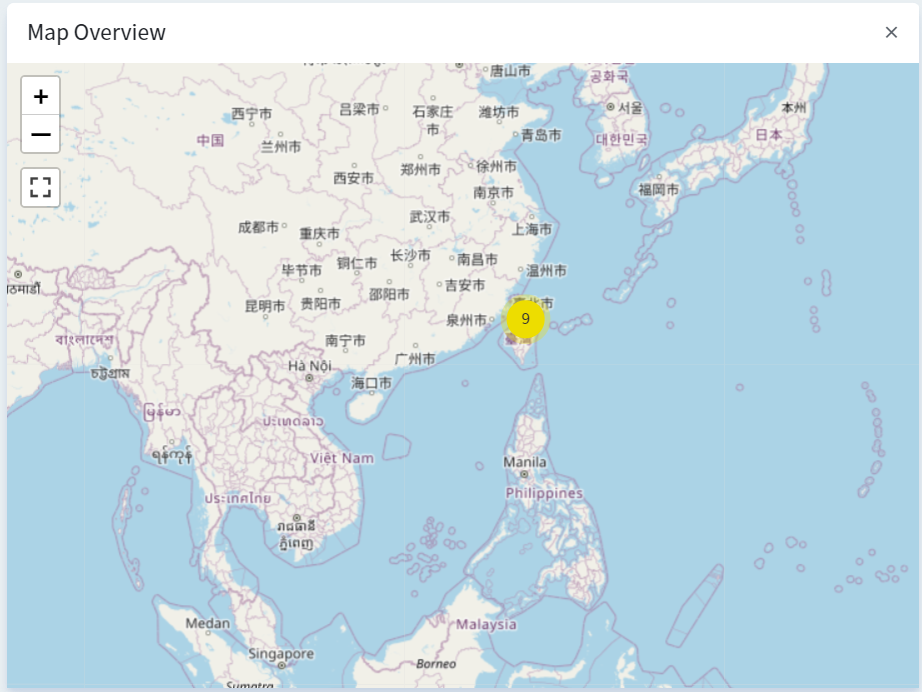
Map Overview
Also, the network administrator could view the map to check the location for CPE and Network. It is useful if the company has multiple branches. You can see the status and activity of any DrayTek devices anywhere on the map overview.
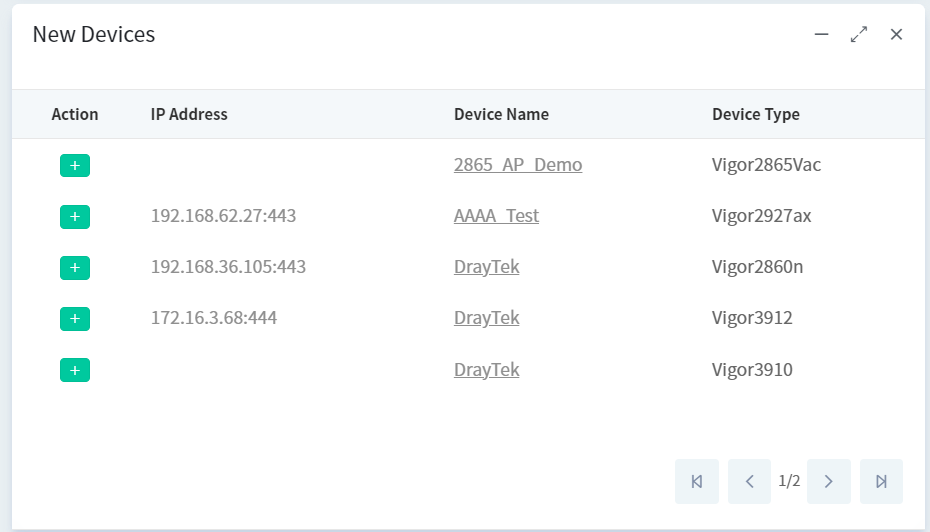
New Devices
Users can use New devices panel to manage their CPE. The new CPE which informs the ACS server will be added to the new devices panel, so the network administrator could check the device quickly and set its parameters afterward.
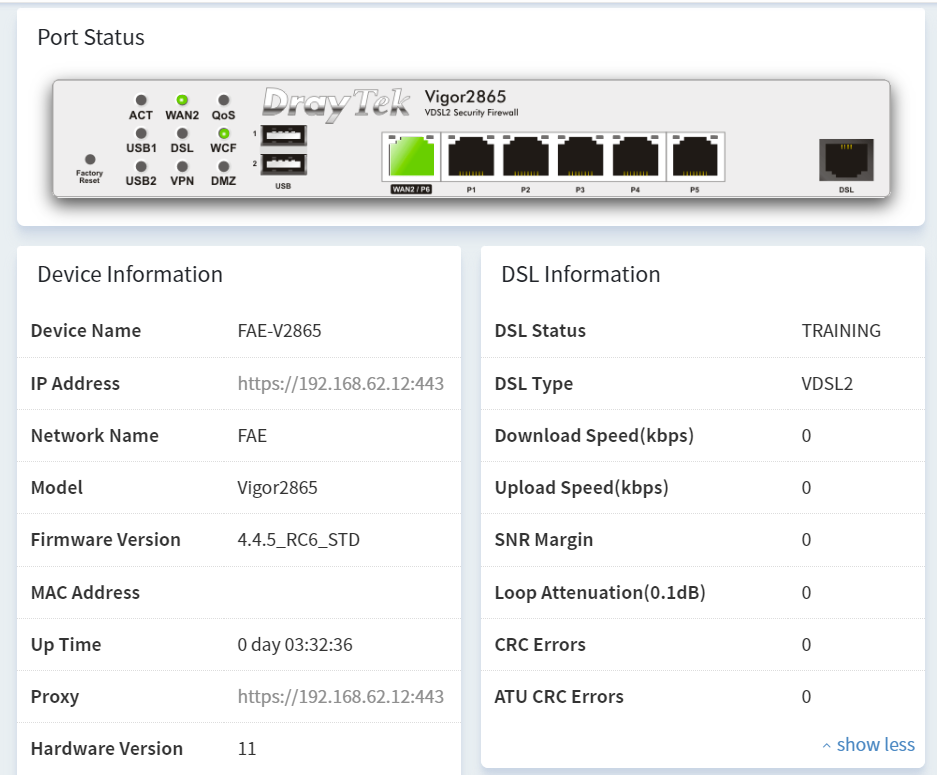
Device Dashboard
The device dashboard displays more details on a single CPE, like DSL, Wireless LAN information, port status. You can see this page by clicking particular CPE; alternatively, you could click the device that showed the network dashboard.
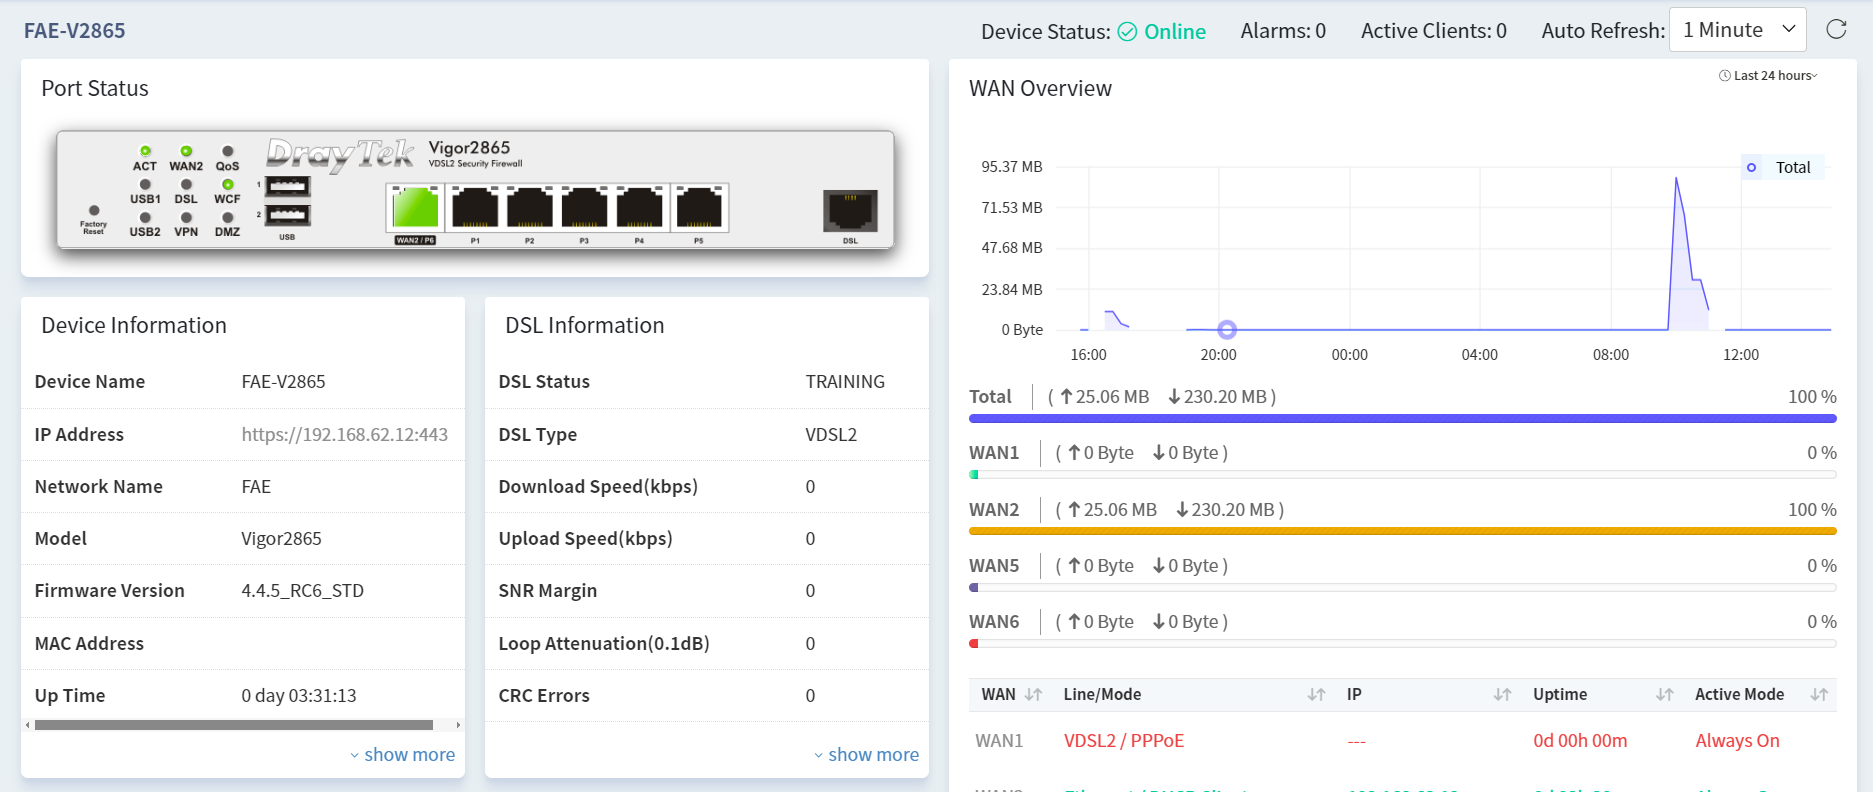
Virtual Panel and Device information
The virtual Panel shows the same status as the CPE, and you will get the corresponding page when you click the part of the panel. For example, you will get into QoS settings page if you click the QoS LED. Device information reports uptime, firmware versions, IP address, etc
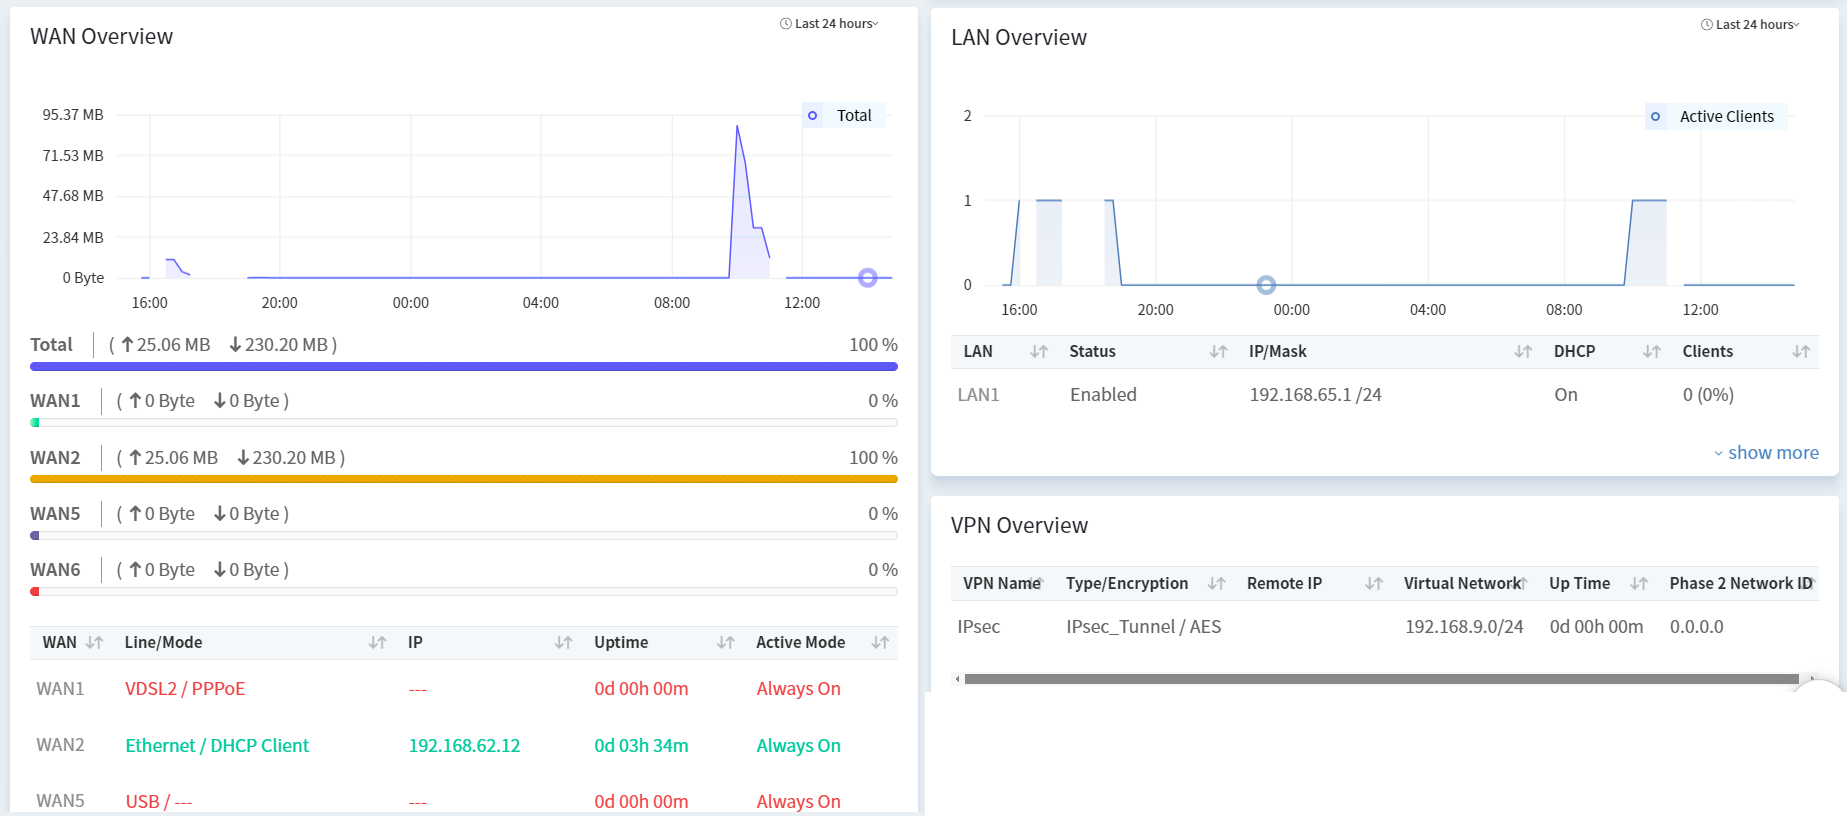
WAN/LAN/VPN Overview
ACS2 collect WAN, LAN and VPN statistics to different panels respectively. We could check the traffic on different interfaces. The interfaces are clickable, and you can compare the statistics on the chart. The network administrator could monitor the status on CPE easily by checking these panels.
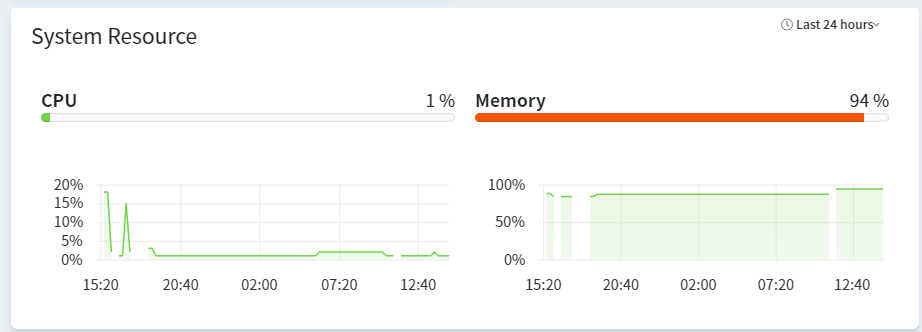
System Resource
The System Resource section will show you the current CPU (Central Processing Unit) usage and the memory load that is in use by the device.
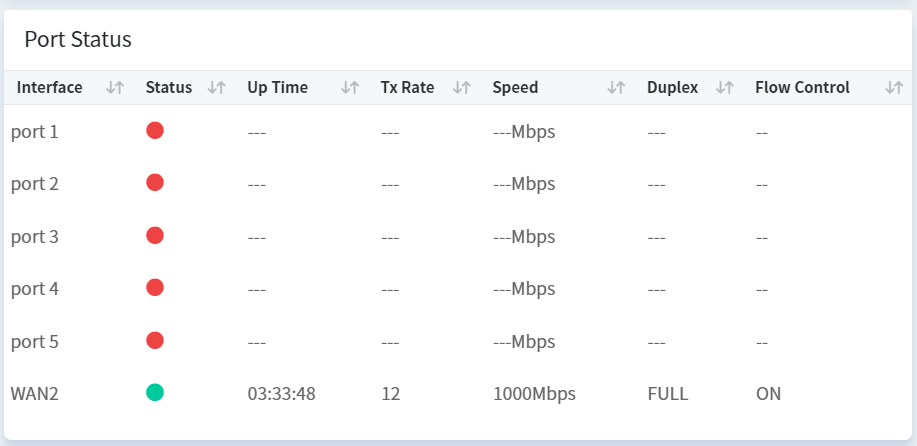
Port status
Users could check their port status on this panel.
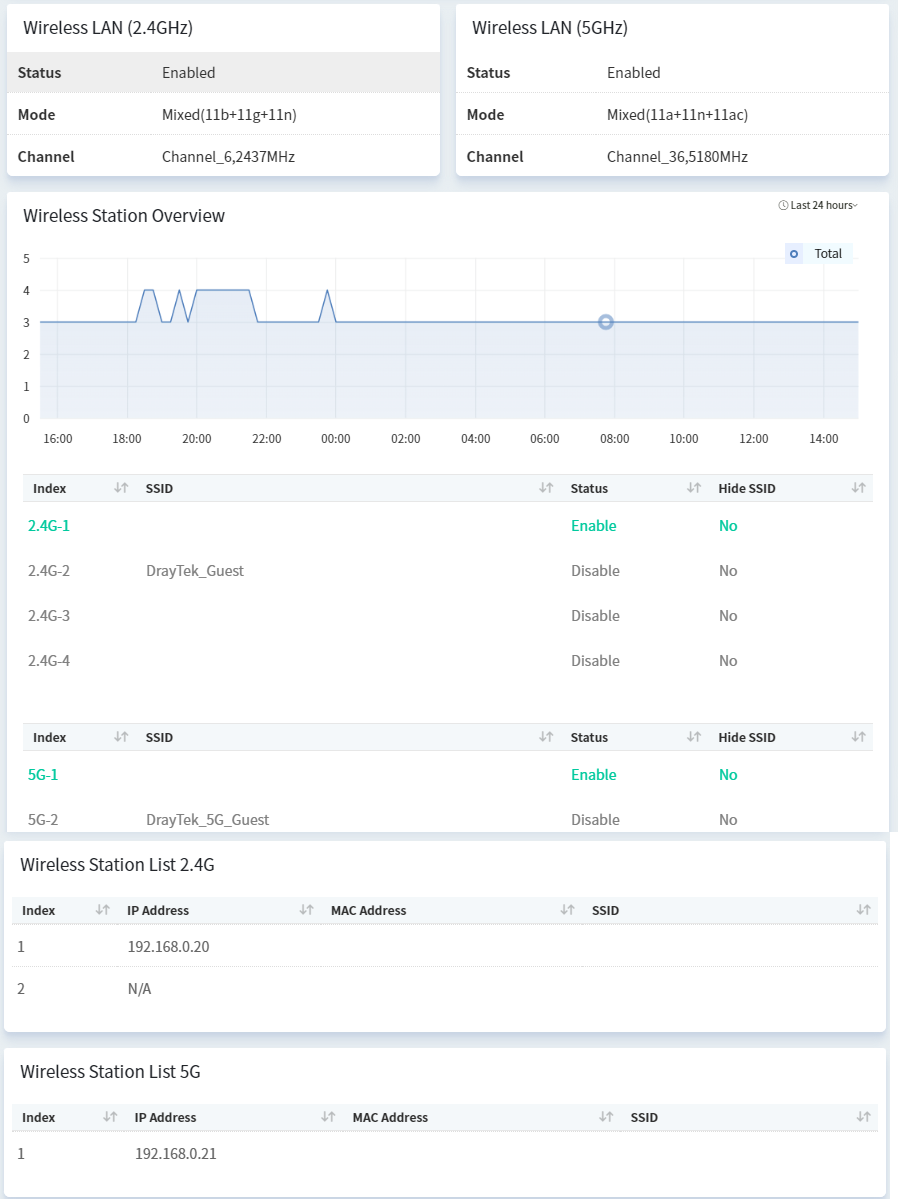
WLAN information
If the CPE is a Wireless model, below the System resource, is a Wireless overview, shows not only the Wireless information but also display the station list. You can refer to the charts to compare with the traffic on different SSID and stations.
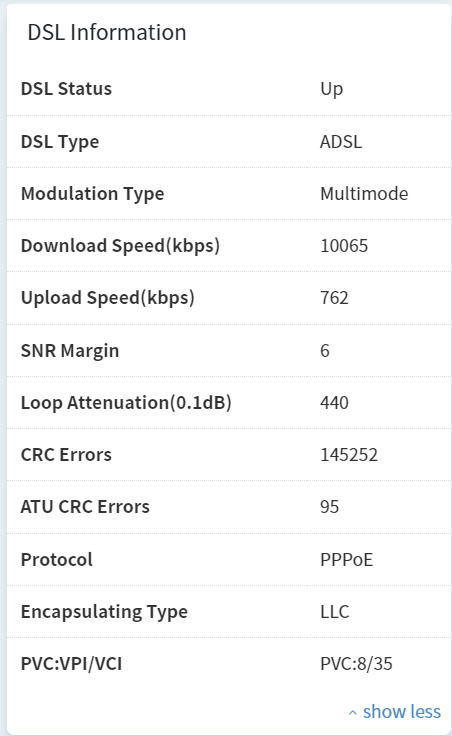
DSL Information
The dashboard will display the DSL information if the CPE is a DSL model, it shows status, Download/Upload speed, and SNR details.
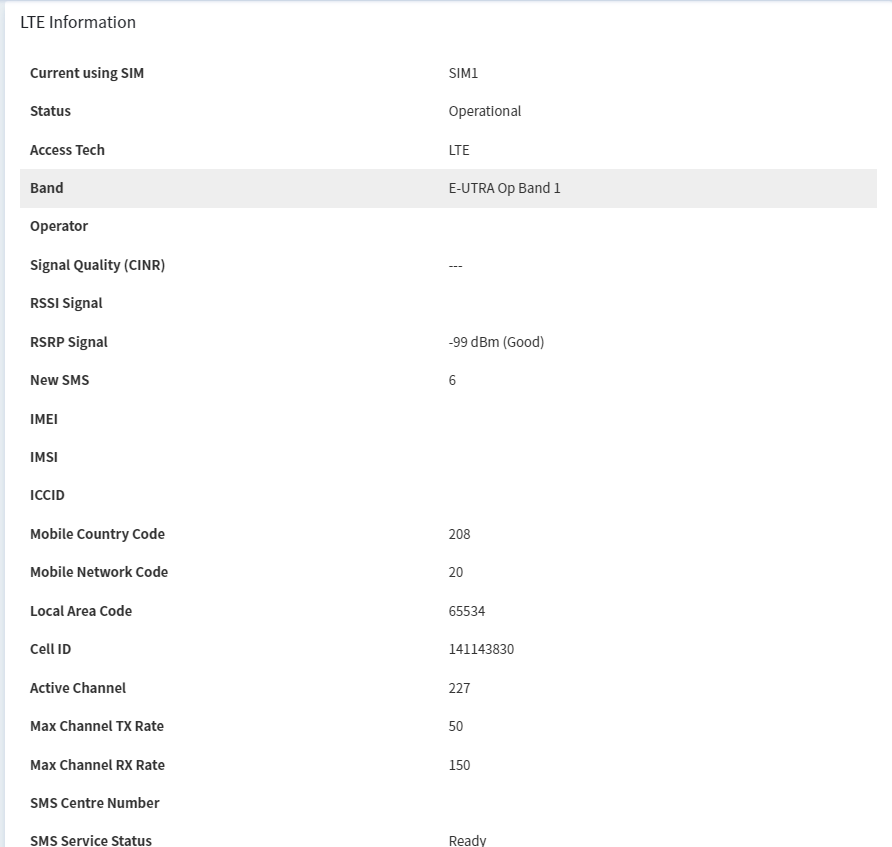
LTE Information
The dashboard also displays the LTE information if the CPE is a LTE model, including LTE band, operator, MCC/MNC...etc.
Published On:2018-12-13
Was this helpful?